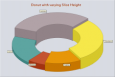
Chart Data
Advertisement
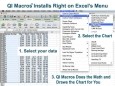
QI Macros SPC Software for Excel v.2016-08
Affordable, easy to use SPC add-in for Excel draws pareto charts, control charts, histograms, box and whisker plots, scatter plots and more. Just select your data and then select a chart from QI Macros menu. Automated fishbone, statistical tests too.
Advertisement
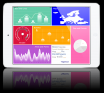
TeeChart NET for Xamarin.iOS v.2018
TeeChart Charting component for Xamarin.iOS offers a wide range of common and specialized chart types, gauges and maps with customizable tools for data visualization in the mobile applications.
Steema TeeChart for .NET 2011 v.4.1.2011.10194
The current Chart for .NET version offers a great generic Charting control for a myriad of charting requirements, targeting too, important vertical areas such as the financial, scientific and statistical worlds.
ChartFire for Mac v.1.0.0.36
ChartFire for Mac is an indispensable plug-in that lets you go beyond the data representation capabilities of FileMaker.
TeeChart NET for Xamarin.Android v.2018
TeeChart Charting component for Xamarin.Android offers the most common chart types, gauges and maps with customizable tools for data visualisation in mobile applications.
TeeChart Pro VCL / FMX v.2018
TeeChart VCL/FMX charting components library offers full set of Graph styles in 2D and 3D for data visualization, 50+ financial and statistical indicators for you to choose from together with an unlimited number of axes and 30 Palette components.
AnyChart JS Charts and Dashboards v.8.7.0
AnyChart is a flexible, cross-platform/browser, dependency-free JS chart library for adding interactive bar, area, pie, column, spline, scatter, line, gauge, treemap, funnel, sparkline, Mekko, Venn, other HTML5 charts/dashboards to any website/app.
BusinessBubbles v.3.5
Easy, fast and visual decision making inc entry, model, ranks, score and charts. Entry: Numbers, radio bar ranges, must-haves, %. Grids: Traffic lights, Averages, Statistics. Charts: Bar, Star Charts, Strength and Bubble (2x2). Smarts: Hi-Lo, Weigths
TrendCompass v.1. 2. 2002
Trend Compass is a data visualization software using the latest and most powerful ideas in data visualization which is the Animated Motion Chart.
LabChart Reader v.7.2.1400
LabChart Reader is a free application program that allows you, your colleagues and students to view and conduct limited analysis of LabChart data files.
TeeChart Pro VCL/FMX v.2012
VCL Charting Component Specifications: -For Delphi 5,6,7,8 (.Net), 2005, 2006, 2007, 2009, 2010, XE, XE2 and C++ Builder 5,6, 2007, 2009, 2010, XE, XE2, Developer Studio 2006, RAD Studio 2007, 2009, 2010, XE, XE2 and FireMonkey -Printing and